Washington DC
Washington DC solar in 2026
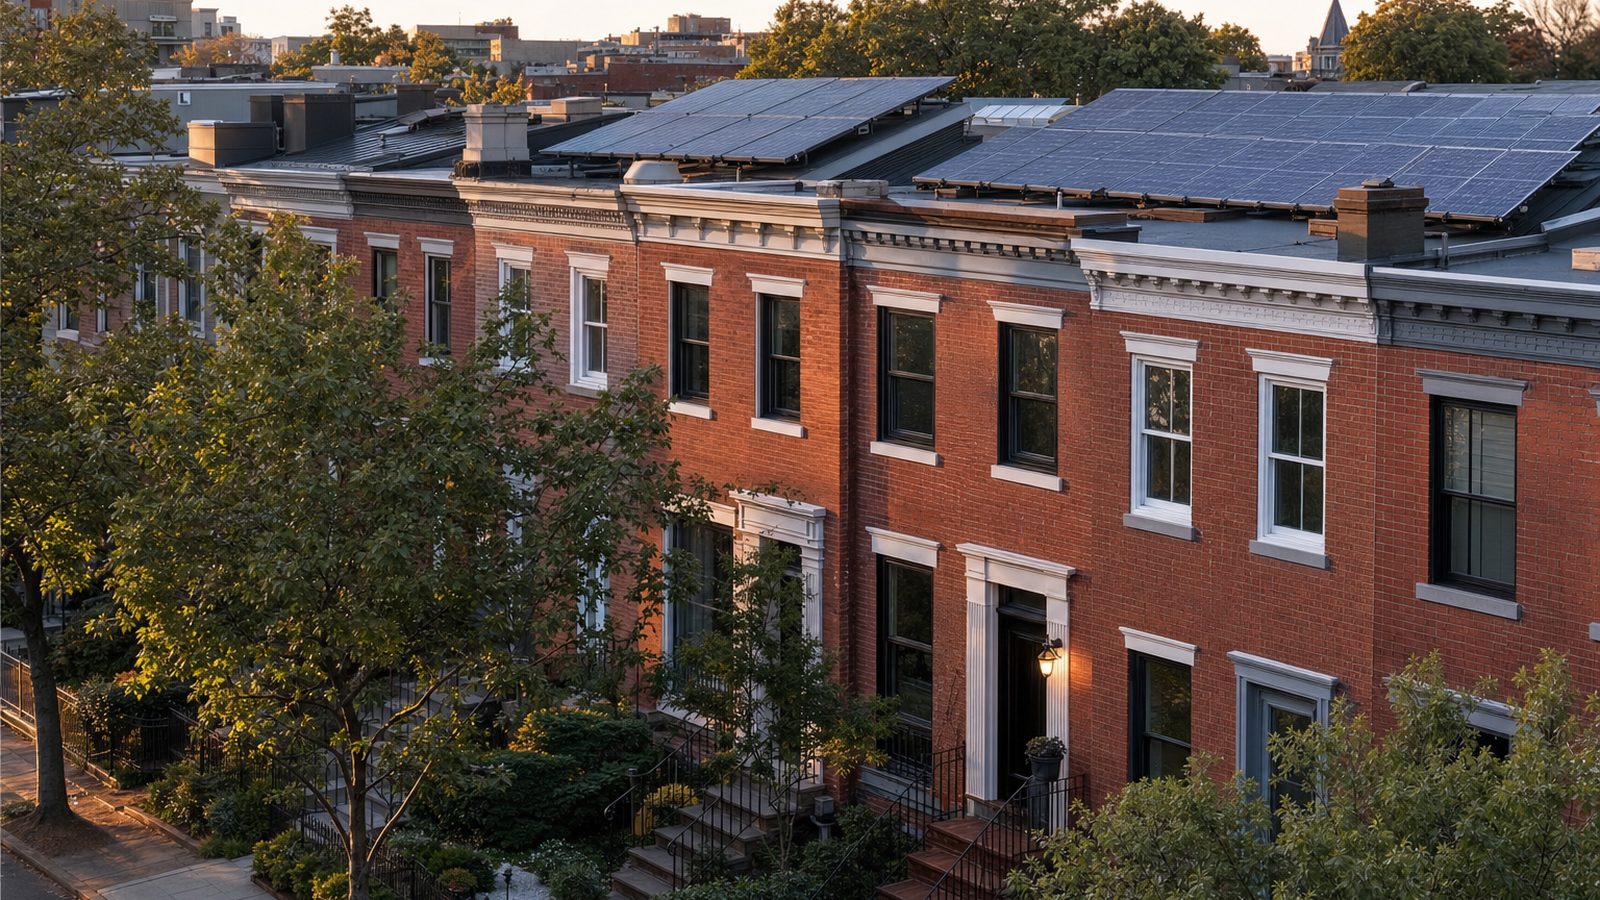
Washington DC is not a sunshine contest. It is a value-per-kWh contest, and the District has stacked the deck. A modest roof can earn retail bill credits and produce SRECs in the strongest market in the country. If a quote treats SRECs as a footnote, it has missed the economics.
What Washington DC energy costs, beside an owned roof
The electric rate is high enough to matter. Gas is not the comparison that decides a solar purchase, but it puts the energy ledger in the same units. The roof line is the useful one: an owned system produces energy at a calculated long-run cost before SREC revenue is counted.
| Energy source | Type | Average price | What that means |
|---|---|---|---|
| Statewide residential blend | Electricity | 25.4¢ per kWh | EIA statewide residential blend through May 2026. |
| Residential natural gas | Natural gas | $22.01 per Mcf | 7.2 cents per thermal kWh. 1 Mcf is about 304 kWh of thermal energy. |
| Rooftop solar, owned | Electricity | ~8.7¢ per kWh | Levelized cost over 25 years from the EnergySage $3.00 per watt state cost and our PVGIS runs. It values production, not the rules for exported kWh. |
Electricity: EIA Table 5.6.A, May 2026. Gas: EIA natural gas prices, residential, May 2026; 1 Mcf is about 304 kWh of thermal energy. Solar figure is our calculation, with the method on the methodology page.
The District roof is small. The production range is not.
These four DC runs are tightly clustered, which is the point. A block-by-block address is not going to rescue a shaded rowhouse roof. Roof geometry, historic review, equipment placement, and the ability to keep a clean array matter more than chasing a different neighborhood.
| City | kWh per kW per year | Annual output, 9.71 kW system |
|---|---|---|
| Washington | 1,369 | 13,293 kWh |
| Georgetown | 1,399 | 13,579 kWh |
| Anacostia | 1,378 | 13,376 kWh |
| Tenleytown | 1,388 | 13,474 kWh |
Method: PVGIS v5.2 model runs by Solar Learning Lab on August 18, 2026, using the NSRDB radiation database. Assumptions: fixed roof mount, south facing, 30 degree tilt, 14 percent losses. Your roof will differ. The 9.71 kW example matches the EnergySage Washington DC average system.
Full retail credits, then the SREC engine
DC net energy metering credits monthly excess at the full retail rate, including generation, supply, and distribution. Unused credit rolls forward in kWh. At the calendar-year reset, the remaining excess is valued at the generation rate, and remainders over $25 are refunded. That is already a strong self-consumption rule.
But DC is not mainly a net-metering story. The 2026-vintage SREC price is $330.00. SREC revenue is why an extra clean, permitted module can matter here. The Commission raised the generation threshold to 200% of historical use in 2024, so a homeowner with a productive roof should ask an installer to model the SREC registration and who owns the certificates, not just annual utility savings.
DC net-metering mechanics and the generation threshold. Read the utility or regulator document linked there before relying on a sales representation.
The serious incentive is a market payment
| Item | Value | Fine print |
|---|---|---|
| DC SREC market | $330.00 for a 2026-vintage Washington DC SREC | The current market price is ongoing revenue, but it is a market price. Confirm the aggregator agreement and certificate ownership. |
| Solar for All | 50% bill savings over 15 years, program expectation | For eligible low- and moderate-income participants, DOEE says participants should expect this bill-saving outcome. It is program access, not a universal cash rebate. |
| Personal property tax | Solar systems are exempt | D.C. Code §47-1508(a)(11) covers systems using exclusively solar energy. |
| 25D, homeowner-owned system | Ended as of December 31, 2025 | Lease and PPA providers can still claim 48E and share some value in pricing (CRS) |
State incentive detail: program or statute.
The District's value stack has three separate moving parts
Start with the monthly bill rule. Excess generation is credited at the full retail rate, including generation, supply, and distribution, and unused credit rolls forward as kWh. At calendar year end, leftover excess is paid at the generation rate only; amounts over $25 are refunded. That makes month-to-month matching valuable, but it is not permission to model every annual surplus kWh at the full retail rate. The reset rule needs to appear in the financial model. PSC order analysis
Then look at system headroom. The former threshold was 100% of a customer's annual historic use. The Commission approved a 20% annual increase beginning in 2020 until the threshold reached 200% in 2024. Pepco can seek suspension of a scheduled increase by October 1 if it identifies reliability, safety, or cost effects. Without that request, the increase proceeds automatically. A homeowner who is electrifying equipment or planning an addition should have the installer document the historic-use basis rather than treating the 200% threshold as a slogan. DC PSC 2026 RPS report
For eligible low- and moderate-income households, Solar for All is another route: the program aims to bring solar benefits to 100,000 families, and participants should expect 50% electricity-bill savings over 15 years. That is a program-access question, not a universal rebate in an ordinary rooftop quote. DOEE Solar for All
Finally, community solar has a distinct track. Pepco's Community Net Metering Rider and Community Renewable Energy Facilities were established under the Community Renewable Energy Amendment Act of 2013. Order 20334, dated April 22, 2020, removed the requirement that a CREF connect directly to the DC distribution system. This matters when the roof is the constraint. There were 18,663 net-metered PV customers in the District in 2024, including 17,780 residential customers, and small-scale PV accounted for 277.9 MW of the District's 312.5 MW total PV in May 2026. Roof access is a real asset here. DC community-net-metering record EIA DC electricity tables
The District's residential rate was 25.40 cents per kWh in May 2026, up from 20.43 cents per kWh in May 2025, a 24% increase. The personal-property exemption for systems using exclusively solar energy sits in D.C. Code §47-1508(a)(11), alongside an annual $120,000 transfer from the Renewable Energy Development Fund to the General Fund beginning in fiscal year 2013. Keep those items separate from SREC revenue. The exemption is tax treatment; the certificate is a market payment. EIA Table 5.6.A D.C. Code §47-1508
Run the SREC math separately from utility savings
The calculator starts from the electric bill, installed cost, and modeled output. It does not pretend a certificate market is guaranteed cash. Use the result as the energy side of the decision, then have each bidder show SREC ownership, registration, and their exact revenue assumption.
Slider bounds come from four PVGIS runs across Washington DC. The range reflects location, not the shading, roof direction, snow cover, or equipment on your particular roof.
Cash quotes in Washington DC cluster near $3.00 per watt, against a $3.50 national 2024 median (LBNL). Use your quote.
Assumptions you can change
Use the rate on your actual lease or PPA quote. There is no published statewide average we trust enough to hardcode.
Cash purchase
$11,700 after state credit
- Year 1 benefit
- $114/mo
- Payback
- 8 years
- 20 year net position
- $21,546
District SRECs are an ongoing market payment, not a state tax credit. Model SREC revenue separately because the market price can move.
Solar loan
$147/mo 15 yr payment
- Year 1 net
- -$33/mo
- Upfront
- $0
- 20 year net position
- $6,745
We price loans at $4.2 per watt: the EnergySage cash figure plus the $1.20 national loan-over-cash spread LBNL documents, since dealer fees get built into loan pricing.
Lease / PPA
$0 down you buy the power
- Year 1 net
- $6/mo
- Upfront
- $0
- 20 year net position
- $3,342
A lease or PPA provider may claim the federal 48E business credit. Compare the contract price with an owned quote and the SREC arrangement.
Estimates, not quotes. Inputs use the Washington DC average rate from EIA, our own PVGIS production runs, and EnergySage August 2026 cost data. We are a solar installer and we also partner with other solar companies. See our disclosures.
District-specific moves that improve the decision
- Demand a separate SREC line in every proposal. A claim that quietly rolls a $330.00 certificate price into lifetime savings is not a quote you can audit.
- Design around roof scarcity. Washington, Georgetown, Anacostia, and Tenleytown model in a narrow production band, so an unshaded panel position is more valuable than a different DC address.
- Read the calendar-year excess rule before oversizing. Monthly credits roll, but leftover annual credit is not full-retail value.
- If Solar for All may fit your household, check program eligibility before accepting a conventional sales pitch.
- Ask who submits the Pepco interconnection paperwork and the SREC registration. In DC, paperwork is part of the asset.
Washington DC installers to investigate
The District has a real local bench. Review counts do not prove workmanship, but they give you a place to start. Ask each company to show its SREC arrangement, roof plan, and responsibility for Pepco and District paperwork before comparing price.
Solar Solution DC
Washington, DC
4.8(553 Google reviews)
Revolution Solar
Washington, DC
4.9(543 Google reviews)
Sol Systems
Washington, DC
4.3(294 Google reviews)
City Renewables
Washington, DC
4.9(95 Google reviews)
Uprise Solar
Washington, DC
4.9(90 Google reviews)
Ratings snapshot: Google Maps, August 2026, via the DataForSEO SERP feed. Zero companies paid us and none are endorsed by us. We did not identify a single statewide solar contractor license authority. Confirm District permit requirements and the electrical credentials required for your address before signing.
Get a Washington DC solar estimate
Four questions, answered against this page's EIA and PVGIS data. We are a solar installer and we also partner with other solar companies. Details in our disclosures.
What does your monthly electric bill look like?
Washington DC average is $113 per month (EIA, 2024).