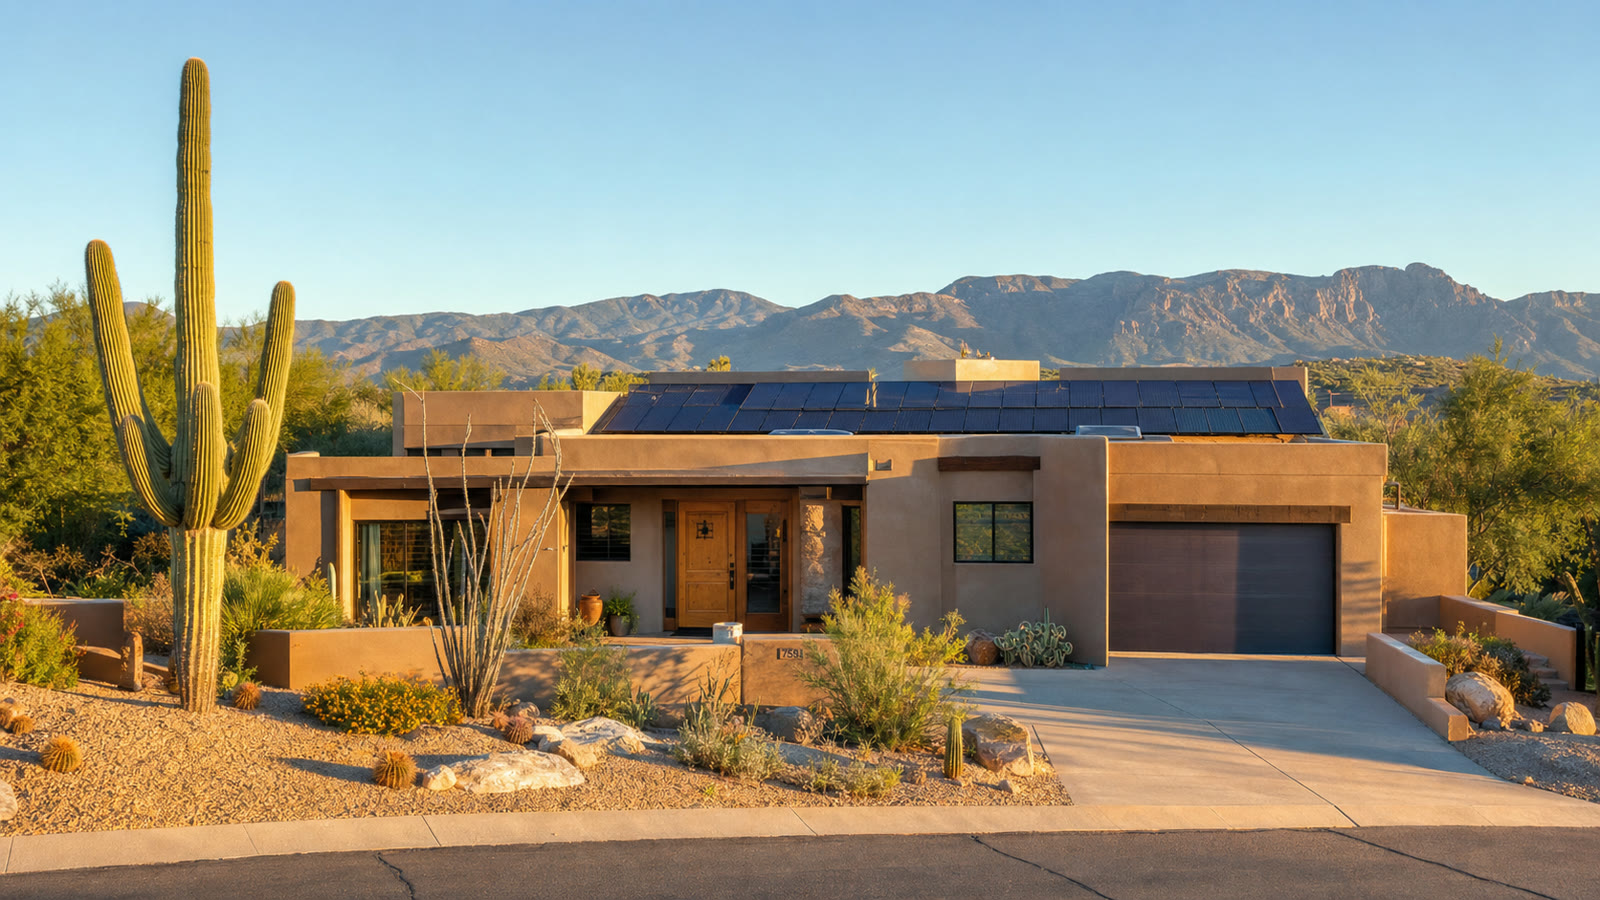
Arizona
Arizona solar in 2026
Start with the number that makes Arizona different: the worst producing city we modeled here, Flagstaff at 7,000 feet, still beats the best city in California. The sun is not the question in Arizona. The question is a calendar. Export rates step down every September 1, your rate locks for ten years at interconnection, and a slow installer can quietly cost you a tranche. In this state, timing is an incentive.
What Arizona pays for energy, three ways
Grid electricity in Arizona is cheaper than the national average, and gas barely figures in most desert households. The relevant comparison is the first row against the last: what APS or SRP charges you per kWh versus what a paid off roof produces one for.
| Energy source | Type | Average price | What that means |
|---|---|---|---|
| APS / SRP / TEP | Electricity | 15.23¢ per kWh | Statewide residential blend reported by EIA through May 2026. Under time of use plans the summer afternoon kWh you offset with solar runs well above this blended figure. |
| Southwest Gas | Natural gas | $22.44 per Mcf | EIA gas series for Arizona homes, May 2026. Works out near 7.4 cents per thermal kWh, though cooling driven households barely touch it. |
| Rooftop solar, owned | Electricity | ~4.9¢ per kWh | Levelized from a $2.20 per watt cash build over 25 years of PVGIS modeled output. Applies to the energy you use onsite; anything exported earns the smaller utility credits detailed below. |
Electricity: EIA Table 5.6.A, May 2026. Gas: EIA natural gas prices, Arizona residential, May 2026; 1 Mcf carries roughly 304 kWh of thermal energy. Solar figure is our own calculation, method on the methodology page.
The sun, quantified
Same PVGIS model, same assumptions we use in every state: south facing, 30 degree tilt, 14 percent losses, run August 17, 2026. Look at the spread. In New York the gap between best and worst city is 11 percent. In Texas it is 31 percent. In Arizona it is under 3 percent. There is no wrong city for solar production in this state, including the one at elevation with snow on the ground in January.
| City | kWh per kW per year | Annual output, 13.7 kW system |
|---|---|---|
| Tucson | 1,840 | 25,208 kWh |
| Yuma | 1,836 | 25,153 kWh |
| Phoenix | 1,807 | 24,756 kWh |
| Mesa | 1,792 | 24,550 kWh |
| Flagstaff | 1,790 | 24,523 kWh |
Method: PVGIS v5.2, NSRDB radiation database, model runs by Solar Learning Lab. The 13.7 kW example matches the EnergySage Arizona average system of 13.72 kW.
September 1 is the date that matters
Arizona ended retail net metering in 2016. What replaced it, the Resource Comparison Proxy framework, works like this: your utility publishes an export rate, well below retail. That rate can fall up to 10 percent each year, with new tranches taking effect September 1. Whatever rate is in force when your system interconnects is yours for 10 years. To claim a closing tranche, your interconnection application generally must complete within 180 days (270 for APS) of submission.
Read that again as a homeowner: sign in July, and if your installer dawdles past the completion window, you land in the next, lower tranche, and that haircut compounds for a decade. When you interview Arizona installers, ask for their average submission to interconnection time in your utility territory. It is a more useful number than most of what appears in the brochure.
| Utility | Export rate | Status |
|---|---|---|
| SRP (Phoenix area, public utility) | 3.45 c/kWh, fixed | Published in current price plans alongside the E-23 residential plan's 12.04 c/kWh summer energy charge |
| APS | 6.171 c/kWh current, 5.554 proposed for Sept 2026 | Secondary source figures we could not confirm on aps.com; treat as approximate until your quote confirms |
| TEP (Tucson) | 5.70 c/kWh (2024-25 published) | 2026 tranche unverified; a roughly 12 percent rate increase proposal is pending |
Sources: SRP solar price plans; Arizona Corporation Commission solar FAQs for the RCP framework mechanics. Where we could not verify a 2026 number from a primary document, we say so instead of guessing.
Incentives: modest, permanent, worth filing
| Item | Value | Fine print |
|---|---|---|
| State credit, Form 310 | 25% of cost, $1,000 lifetime cap | Cumulative cap per residence across all solar devices, 5 year carryover (Arizona DOR) |
| Property tax | Solar adds nothing to assessed value | A.R.S. 42-11054 grandfathered exemption for renewable systems (statute text) |
| Sales tax | Retail exemption on solar equipment | Long standing exemption; the current statutory cap details are ones we have not verified this year, so ask your installer to itemize tax on the quote |
| Federal 25D | Ended December 31, 2025 | Lease and PPA providers can still claim 48E and share some value in pricing (CRS) |
The honest framing: Arizona's incentives will not carry a marginal deal the way New York's $5,000 credit can. They do not need to. At $2.2/W cash median and 1,800 plus kWh per kW, the resource does the work. The reason EnergySage still shows a 12.22 year average payback is the low export rate paired with 15 cent grid power, which is why sizing to your own consumption matters more here than anywhere.
Model it with the export haircut in mind
The calculator credits self consumed power at the retail rate and treats the state credit correctly (25 percent, $1,000 cap). What it cannot know is your export share. An Arizona home with daytime AC load might self consume most of its production; a snowbird house sitting empty all summer exports heavily at 3 to 6 cents. Between those two houses, identical systems, the economics diverge by years.
Slider bounds come from our PVGIS runs across five Arizona cities. The spread is tiny: Flagstaff at 7,000 feet still lands within 3 percent of Tucson. The whole state gets sun.
Cash quotes in Arizona cluster near $2.20 per watt, against a $3.50 national 2024 median (LBNL). Use your quote.
Assumptions you can change
Use the rate on your actual lease or PPA quote. There is no published statewide average we trust enough to hardcode.
Cash purchase
$14,400 after state credit
- Year 1 benefit
- $161/mo
- Payback
- 8 years
- 20 year net position
- $32,349
No federal credit. Arizona still pays its own: 25 percent of cost, capped at $1,000 lifetime per residence on Form 310, plus the property tax carve out under A.R.S. 42-11054.
Solar loan
$205/mo 15 yr payment
- Year 1 net
- -$44/mo
- Upfront
- $0
- 20 year net position
- $9,861
We price loans at $3.40 per watt: the EnergySage Arizona cash figure plus the $1.20 national loan-over-cash spread LBNL documents, since dealer fees get built into loan pricing.
Lease / PPA
$0 down you buy the power
- Year 1 net
- -$92/mo
- Upfront
- $0
- 20 year net position
- -$23,380
The provider keeps the federal 48E business credit and prices some of it into your rate. Your export rate lock still keys to your interconnection date either way.
Estimates, not quotes. Inputs use the Arizona average rate from EIA (Table 5.6.A, May 2026), our own PVGIS production runs, and EnergySage August 2026 cost data. Export compensation here is well below retail (SRP pays a fixed 3.45 cents per exported kWh), so oversizing a system hurts more in Arizona than in net metering states. We are a solar installer and we also partner with other solar companies. See our disclosures.
Arizona specifics worth acting on
- If you are going to do it, interconnect before September 1. The RCP structure makes late summer the most expensive time of year to be slow (ACC).
- SRP and APS are different worlds. SRP is a public power district the Corporation Commission does not regulate, with its own demand based solar plans. Get the specific price plan name in your quote, not just "net billing."
- Heat costs you a little: panel output derates above 25C cell temperature, and our PVGIS runs already bake that into the 14 percent loss assumption. Phoenix at 1,807 is the after heat number, not the before.
- Rates here fell last year. If Arizona power stays cheap, payback stretches; if the pending TEP and APS increases land, it shortens. Run the calculator's escalation slider at 0 and at 4 percent and treat the truth as living between them.
Arizona installers with the receipts
Arizona's installer economics survived the export rate cuts better than the doom headlines suggest, and the Valley bench is the proof: hundreds of Google reviews per company, not dozens. Our rating pull covers metro Phoenix, where most of the state's volume installs. Tucson and Flagstaff buyers can still use the list; several of these firms quote statewide, and the vetting bar travels even when the companies do not.





Ratings snapshot: Google Maps, August 17, 2026, via the DataForSEO SERP feed. Zero companies paid us and none are endorsed by us. Pull each ROC license record before you put ink on paper.
Go deeper: Phoenix
Phoenix is where Arizona's APS versus SRP split gets decided street by street, and where the September 1 export rate step-down has a hard date. The city guide includes the two-utility comparison table, SolarAPP+ instant permit fees and a month by month curve showing why May beats July here: Phoenix solar in 2026.
Arizona city guides
Permits, utility export rules, and a city-specific PVGIS production model for each market we have researched so far.
Get your Arizona estimate
Four questions, answered against this page's EIA and PVGIS data. We are a solar installer and we also partner with other solar companies. Details in our disclosures.
What does your monthly electric bill look like?
Arizona average is $160 per month (EIA, 2024).