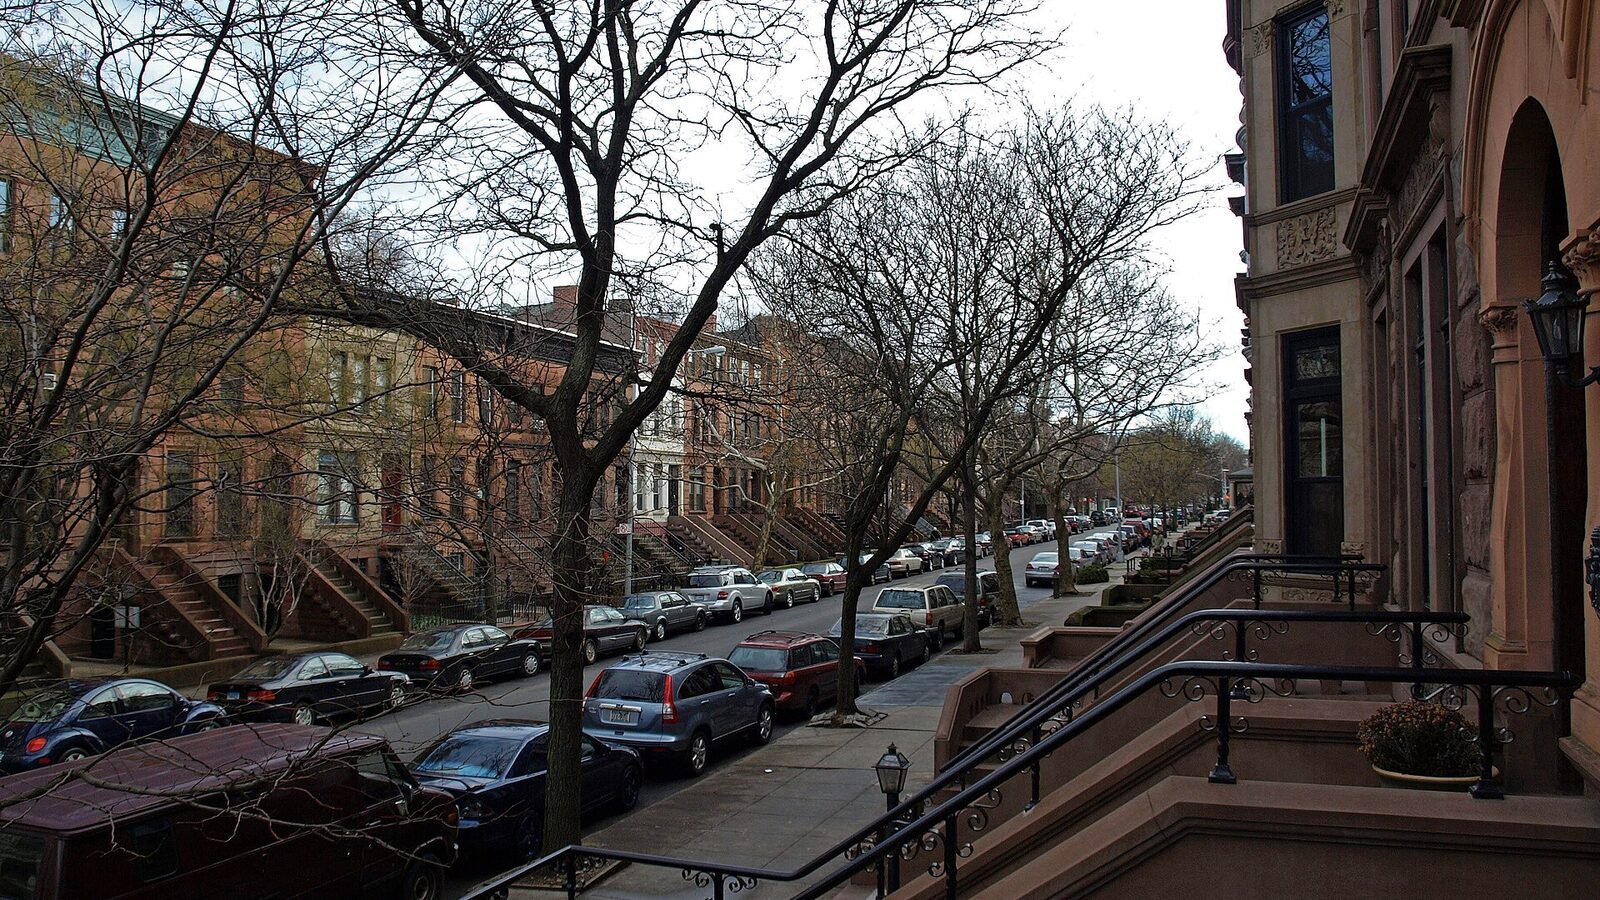
Photo: Chris Pruitt, CC BY-SA 2.0, via Wikimedia Commons
New York · New York City
New York City solar in 2026
Written by the Solar Learning Lab research deskUpdated August 17, 202610 min read
Everything about solar is harder in New York City. The housing stock is vertical, the utility charges solar owners a monthly fee just for being interconnected, the Department of Buildings wants an engineer's stamp on everything, and the sun itself delivers the weakest winters of any market we cover. And yet the arithmetic refuses to die, because the electricity being offset is some of the most expensive in America and it is getting more expensive on an approved schedule through 2028.
29.9¢
New York state average per kWh, and city bills run above it, not below
$2.76/W
Average cash price in New York, so a 7 kW system runs about $19,320 before the state credit
1,314 kWh
Annual output per kW installed, from our PVGIS run for New York City
See if a city roof clears the CBC
Four questions, priced with Con Edison benchmarks, the IT-255 state credit and our NYC production model. The math shows before any contact info.
Get my New York City estimateThe rate nobody will print
Con Edison does not publish a simple cents per kWh figure for residential service; its rates page routes you to tariff leaves on the state commission's site. What the utility does say: New York City residential customers face an average increase of about 5.7 percent for summer 2026, delivery rates rise 2.8 percent annually, and a NYC customer using 280 kWh sees a $4.03 monthly increase. For a benchmark, the EIA puts the New York state residential average at 29.93 cents per kWh in May 2026, and city rates run above the state average, not below it.
Sources: Con Edison, about our rates; EIA Table 5.6.A, verified August 17, 2026. Note the framing: 280 kWh is Con Edison's illustration figure for a city apartment, not a published average. A brownstone with electric appliances can run several times that.
The CBC: solar's monthly cover charge
Since January 2022, new residential solar in New York pays a Customer Benefit Contribution, a fixed monthly charge based on system size. The 2026 Con Edison rates are $1.29 per kW DC per month for net metered systems and $0.65 for Value Stack systems. A 7 kW net metered array pays about $9.03 a month, roughly $108 a year, before producing anything. The charge is set annually, so it is not locked at interconnection, and it does not apply to systems interconnected before 2022 or to community solar subscriptions.
| Compensation path | 2026 CBC, per kW DC monthly | What exports earn |
|---|---|---|
| Phase One net metering | $1.29 | Retail rate credit, the default for new residential |
| VDER Value Stack | $0.65 | Stacked components priced per kWh and per kW, reset on annual statements |
Sources: Con Edison CBC Statement No. 7, effective 01/01/2026; NYSERDA 2026 CBC rates; Value Stack Statement No. 101, effective 02/01/2026, which prices the environmental component at 3.103 cents per kWh and the community credit at 12 cents where available. For a typical rooftop system, plain net metering remains the simpler and usually better deal; the Value Stack exists mainly for community and commercial projects.
Con Edison power, city gas, and solar, side by side
The city's energy stack is split between Con Edison electricity everywhere, and gas service from Con Edison in most of the city or National Grid in Brooklyn and much of Queens and Staten Island. Here is each one priced against a kWh from an owned rooftop system, with the CBC handled honestly in the note.
| Energy source | Type | Average price | What that means |
|---|---|---|---|
| Con Edison | Electricity | 29.93¢ per kWh | EIA New York state residential average, May 2026. Con Edison's own materials say city rates sit above the state line, so read this as a floor. |
| Con Edison / National Grid | Natural gas | $22.74 per Mcf | New York state residential average, May 2026, the latest EIA month, labeled as such since neither utility publishes a city figure. Roughly 7.5 cents per kWh of raw heat. |
| Rooftop solar, owned | Electricity | ~8.4¢ per kWh | Our estimate: $2.76 per watt cash over 25 years of NYC PVGIS output, before the IT-255 credit. The net metering CBC adds about 1.2 cents on top; the state credit pulls the figure well below it. |
Electricity: EIA Table 5.6.A, May 2026. Gas: EIA natural gas prices, New York residential, May 2026; 1 Mcf holds about 304 kWh of thermal energy. Solar figure is our own calculation, method on the methodology page.
A New York City roof, month by month
The city's production curve is the steepest of our five: December delivers 68.9 kWh per kW while July delivers 134.6, a two to one swing. Annual net metering rollover is what makes this survivable. Summer overproduction banks credits that winter burns down. Sizing matters more here than anywhere: a system that just covers annual usage keeps every credit; one sized far past usage donates the surplus.
December, highlighted, is the floor at 68.9 kWh per kW, about half of July. The banked summer credits are not a bonus in this market. They are the plan.
Method: PVGIS v5.2, NSRDB radiation database. PVGIS v5.2 model run by Solar Learning Lab on August 17, 2026, NSRDB radiation database. Fixed south facing mount, 30 degree tilt, 14 percent losses, lower Manhattan coordinates. Your roof will differ.
What solar costs in New York City by system size
New York's $2.76 per watt cash average is the highest of our five markets, and city quotes with flat-roof ballast or standing seam work can run past it. The consolation is IT-255: the state income tax credit returns 25 percent up to $5,000, which takes a 7 kW system from $19,320 to a net $14,490. The table shows gross prices and values output at the state average rate.
| System size | Cash price | Year 1 output | Year 1 value at 29.93¢ |
|---|---|---|---|
| 5 kW | $13,800 | 6,572 kWh | ~$1,967 |
| 7 kW | $19,320 | 9,200 kWh | ~$2,754 |
| 8 kW | $22,080 | 10,514 kWh | ~$3,147 |
| 10 kW | $27,600 | 13,143 kWh | ~$3,934 |
Our calculations: size times $2.76 per watt from EnergySage New York cash averages, August 2026; output from our PVGIS run of 1314 kWh per kW; value at the EIA state average, which understates most city bills. Estimates, not quotes. Subtract IT-255, 25 percent capped at $5,000, from any of these prices; the federal 25D credit is gone for 2026 cash purchases.
The state credit changes your math
The calculator below builds IT-255 in and takes your actual bill instead of the state average.
Jump to the calculatorSixteen percent of the city has a roof for this
Census data frames the market honestly: of 3.31 million households, just 16.3 percent of housing units are single family, mostly in eastern Queens, Staten Island and pockets of Brooklyn and the Bronx. Those are the rooftops this page's calculator describes. For the other 84 percent, the working paths are community solar subscriptions, which carry no CBC, or a co-op or condo board project on the building's shared roof under the Value Stack.
Source: US Census Bureau, ACS 5-year estimates, 2023, New York city. Owner occupancy 32.8 percent, median income $79,713, 15.5 percent heat with electricity, the lowest share of our five cities. Steam radiators run on gas and oil here, which is why solar offsets lighting and appliances, not heating.
Permits: bring an engineer
- Every building-connected system needs DOB permits, and a professional engineer or registered architect must confirm the structure can carry the load. Every PV job also files an ED16A electrical permit application (NYC DOB).
- Speed exists if your installer uses it: professional certification and Directive 14 allow same-day review in some cases, with typical review at five to ten days for complete applications (NYC DOB).
- Electrical fee mechanics changed mid-2026: half the work permit fee, minimum $130, is due at filing under the new payment advisory, with the DOB's own worked example totaling $180 (Advisory 2026-007).
- There is no flat NYC solar permit fee. Costs are computed from filing and parts fees, so get the permit line in writing on the quote.
The highest rated solar installers in New York City
The city's installer bench is thinner than the sunbelt markets, and it skews toward flat-roof and brownstone specialists, which is what the housing stock demands. These are the strongest Google Maps results at a 4.4 rating floor. Review counts here run smaller than in Phoenix or Houston, so put extra weight on DOB filing experience when you interview anyone.



Ratings and review counts are Google Maps ratings for New York City local results, retrieved August 17, 2026 via the DataForSEO SERP API. We list the highest rated established companies we found. No company paid to appear here, and appearing here is not an endorsement. Check current reviews and licensing before you sign anything.
Run your own numbers
Preloaded with the EIA state average rate, which understates most city bills, and our New York City PVGIS run. The New York IT-255 state credit is built in.
The top of the slider is our south facing PVGIS run for New York City. The lower bound approximates an east or west facing roof, which typically gives up 10 to 15 percent.
Cash quotes in New York City cluster near $2.76 per watt, against a $3.50 national 2024 median (LBNL). Use your quote.
Assumptions you can change
Use the rate on your actual lease or PPA quote. There is no published statewide average we trust enough to hardcode.
Cash purchase
$8,901 after state credit
- Year 1 benefit
- $141/mo
- Payback
- 6 years
- 20 year net position
- $32,137
No federal credit for cash purchases in 2026, but New York's IT-255 state credit still pays 25 percent up to $5,000, and that survives here. Budget for the Customer Benefit Contribution: $1.29 per kW DC per month on net metering, so a 7 kW system pays about $9 a month just to be interconnected.
Solar loan
$126/mo 15 yr payment
- Year 1 net
- $15/mo
- Upfront
- $0
- 20 year net position
- $18,289
We price loans at $3.96 per watt: the EnergySage New York cash figure plus the $1.20 national loan-over-cash spread LBNL documents, since dealer fees get built into loan pricing.
Lease / PPA
$0 down you buy the power
- Year 1 net
- $28/mo
- Upfront
- $0
- 20 year net position
- $9,712
The provider keeps the federal 48E business credit and prices some of it into your rate. In 2026 this is the only path that captures any federal incentive.
Estimates, not quotes. Con Edison does not publish a simple consumer cents per kWh figure, so the rate input uses the EIA New York state average (Table 5.6.A, May 2026), which understates what most New York City customers pay. The model does not subtract the monthly Customer Benefit Contribution. Production comes from our PVGIS run for New York City, cost from EnergySage New York data, August 2026. We are a solar installer and we also partner with other solar companies. See our disclosures.
New York City solar questions, answered from the data
Every answer is drawn from the tariffs and filings cited above, not a national template.
Does New York City still have net metering?
How much does solar cost in NYC in 2026?
What is the CBC and how much does it cost me?
Do I really need an engineer for rooftop solar here?
Is solar worth it with New York winters?
What we could not verify
As of August 17, 2026: no primary Con Edison page publishes a consumer cents per kWh residential rate, so we benchmark with labeled EIA state data. The NYC property tax abatement percentage and cap were not confirmed from a primary page in our research pass, so we cite only the PTA4 filing mechanics. Rockaways service territory details were not confirmed from a primary source. Widely reported annual increase figures of 3.5, 3.2 and 3.1 percent come from secondary coverage; we prefer Con Edison's own 5.7 percent summer figure.
Get your New York City estimate
Four questions, answered against this page's Con Edison, NYSERDA and PVGIS data. We are a solar installer and we also partner with other solar companies. Details in our disclosures.
What does your monthly electric bill look like?
New York average is $167 per month (EIA, 2024).