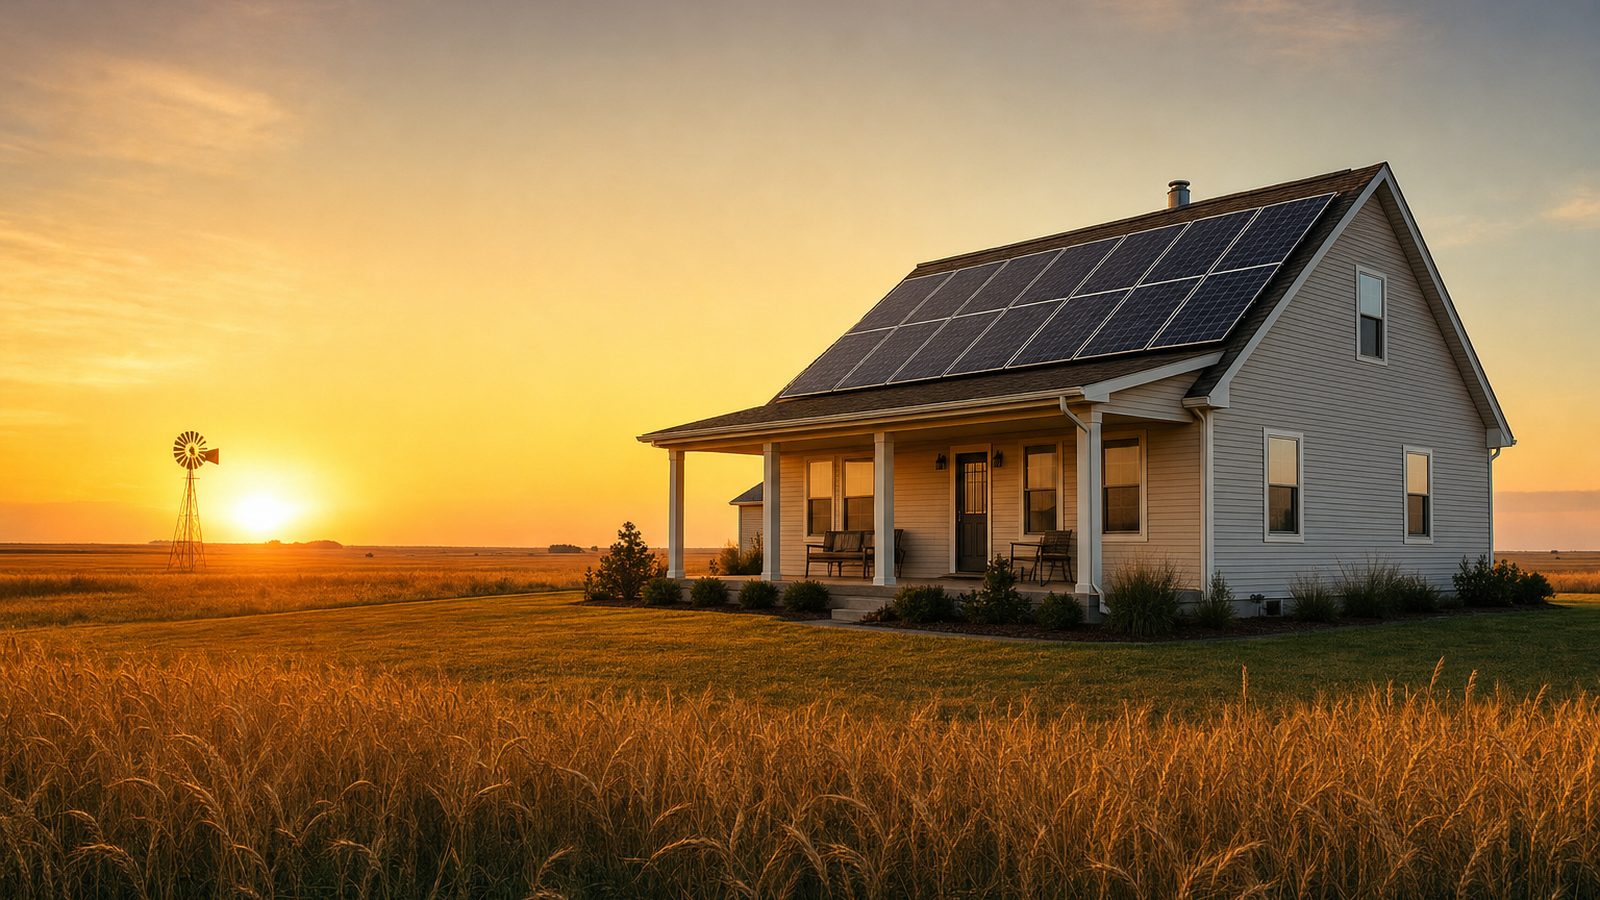
Kansas
Kansas solar in 2026
Kansas has a better solar resource than its modest power bills suggest. Garden City models far above Kansas City. The catch is not sunlight. It is tariff discipline. Net metering is statutory, utility headroom is phased upward, and newer customers do not automatically inherit the old customer tariff.
The solar resource is good. The retail rate is merely decent.
Kansas can support a lean, well-priced solar project. It does not support lazy math. A low installed cost helps, but the utility tariff and the customer's interconnection date remain part of the return. Ask the installer to show the tariff, not a generic statewide savings chart.
| Energy source | Type | Average price | What that means |
|---|---|---|---|
| Kansas household electricity | Electricity | 15.13¢ per kWh | Statewide residential reading, May 2026. |
| Kansas residential gas | Natural gas | $25.12 per Mcf | May 2026 gas-series reading, roughly 8.3 cents per thermal kWh. |
| Owned roof array | Electricity | ~7.0¢ per kWh | Our 25-year production-cost estimate uses EnergySage pricing and Kansas yield runs. |
For grid power, see EIA Table 5.6.A for May 2026. The gas comparison comes from EIA's May gas series; 1 Mcf equals about 304 thermal kWh. We calculate the solar row using the method described on the methodology page.
Western Kansas pulls the production average upward
Garden City is the standout in this set. Kansas City and Topeka are lower. That geographic spread is material, and it makes a city-level yield estimate more useful than a single statewide production claim.
| Location | Modeled kWh per kW | Output from a 12.29 kW example |
|---|---|---|
| Wichita | 1,549 | 19,037 kWh |
| Kansas City | 1,446 | 17,766 kWh |
| Topeka | 1,462 | 17,970 kWh |
| Garden City | 1,682 | 20,675 kWh |
Method: PVGIS v5.2. PVGIS v5.2 model runs by Solar Learning Lab on August 18, 2026, using the NSRDB radiation database. Assumptions: fixed roof mount, south facing, 30 degree tilt, 14 percent losses. Your roof will differ. The 12.29 kW illustration uses EnergySage's average system size.
Kansas has net metering, with headroom that steps up by law
K.S.A. 66-1265 requires utilities to make net metering available on a first-come, first-served basis to customer-generators in good standing. The statutory aggregate cap rose to 2% in July 2024, 3% in July 2025, and 4% in July 2026. It becomes 5% of the utility's historic highest annual peak demand from July 2027, unless the commission authorizes more.
There is a sharp historical divide. Customers interconnected before July 2014 must be offered a tariff identical in energy rates, rate structure, and monthly charges to non-generators, without added standby, capacity, or interconnection fees. For later interconnections, a utility may propose different treatment. Get your actual tariff in the quote and ask whether capacity headroom remains.
Policy source: K.S.A. 66-1265.
No verified state cash credit to paper over a weak quote
| Item | Value | Fine print |
|---|---|---|
| Kansas homeowner cash program | None verified | No verified state payment is included in the economics. |
| 25D homeowner credit | No longer available after December 31, 2025 | A lease or PPA provider may still claim 48E, which can affect its price (CRS) |
Kansas has a renewable property-tax framework in statute listings, but we did not verify a current homeowner value from a primary source. The older solar exemption text ends in 1985. We are not assigning a dollar value to either.
Kansas timing is a tariff issue, not a footnote
Kansas is unusual because the available net-metering headroom follows a calendar written into statute. The aggregate ceiling moved to 2% of a utility's prior-year peak demand on July 1, 2024, then 3% on July 1, 2025, and 4% on July 1, 2026. From July 1, 2027 onward, it becomes 5% of the utility's historic highest annual peak demand since 2014. The Kansas Corporation Commission can lift that ceiling after a hearing. That sequence makes the utility's current capacity answer part of the purchase decision, not post-sale paperwork. K.S.A. 66-1265
There is a second date that changes the conversation. Customers interconnected before July 1, 2014 must receive the same energy rates, rate structure, and monthly charges as non-generators, without added standby, capacity, or interconnection charges. Utilities can propose different treatment for systems interconnected on or after that date. A bid that says only “net metering” has not answered the important question. It should identify the generator tariff, the ordinary customer tariff it is being compared with, and every monthly charge. Kansas statute
Kansas also has a practical utility map. Evergy Kansas Central, Evergy Kansas South, and Evergy Metro accounted for 3,468,990 MWh, 3,181,627 MWh, and 2,854,073 MWh of residential sales in 2024. That concentration means an installer should be able to give a territory-specific answer quickly. If it cannot, pause. The older 2009 law and the KCC rules also assigned renewable energy certificates from net-metered systems to the utility for RPS compliance rather than to the customer. Do not add personal REC income to a proposal without showing why the current utility terms support it. EIA utility sales IREC's rule summary
Kansas had 9,013 net-metered PV customers in 2024, including 8,583 residential customers. EIA reported 433.9 MW of utility-scale PV and 136.7 MW of small-scale PV in May 2026, or 570.6 MW total. Those figures do not predict your queue position. They do show that the market is no longer theoretical, while the statutory first-come, first-served language keeps an application-date record valuable. EIA Kansas profile EIA PV capacity table
Use the calculator, then interrogate the tariff
The calculator uses the statewide rate and city-informed production range. It cannot tell you the remaining utility cap or a post-2014 tariff proposal. Those are documents to obtain before a deposit, not details to sort out later.
The slider bounds come from four Kansas PVGIS runs. Garden City is substantially stronger than Kansas City, so a statewide production figure is only a starting point.
Cash quotes in Kansas cluster near $2.69 per watt, against a $3.50 national 2024 median (LBNL). Use your quote.
Assumptions you can change
Use the rate on your actual lease or PPA quote. There is no published statewide average we trust enough to hardcode.
Cash purchase
$17,216 after state credit
- Year 1 benefit
- $124/mo
- Payback
- 11 years
- 20 year net position
- $18,854
No verified state residential cash rebate or income-tax credit. Kansas net metering is statutory, but tariff treatment can differ for post-2014 interconnections.
Solar loan
$224/mo 15 yr payment
- Year 1 net
- -$100/mo
- Upfront
- $0
- 20 year net position
- -$4,209
We price loans at $3.89 per watt: the EnergySage cash figure plus the $1.20 national loan-over-cash spread LBNL documents, since dealer fees get built into loan pricing.
Lease / PPA
$0 down you buy the power
- Year 1 net
- -$73/mo
- Upfront
- $0
- 20 year net position
- -$18,396
A lease or PPA provider can still claim the federal 48E business credit. It should still identify the Kansas utility tariff and net-metering treatment in writing.
Estimates, not quotes. Inputs use the Kansas average rate from EIA (Table 5.6.A, May 2026), our own PVGIS production runs, and EnergySage August 2026 cost data. We are a solar installer and we also partner with other solar companies. See our disclosures.
Kansas solar diligence that changes the deal
- Ask your utility whether it has remaining aggregate net-metering headroom and which cap applies on your application date. (K.S.A. 66-1265)
- If you are a post-2014 customer, make the quote name the generator tariff and monthly charges. Older customer protections do not automatically carry over. (K.S.A. 66-1265)
- Do not value renewable energy certificates as your personal asset without checking the utility rules. The historical KCC rules assigned RECs from net-metered systems to the utility. (IREC rule summary)
- Kansas City production is not Garden City production. Use a local yield model before accepting one state-average output number. (PVGIS)
Kansas installers to investigate
Kansas bids should name the serving utility, generator tariff, anticipated interconnection path, and whether available program capacity is assumed. Choice is useful only when every proposal answers those points. Kansas does not have a verified statewide solar-installer licensing authority in our review, so check credentials with the local authority having jurisdiction.
Shinnova Solar
Kansas City, KS
4.9(495 Google reviews)
Good Energy Solutions
Lawrence, KS
5.0(261 Google reviews)
Blue Raven Solar
Overland Park, KS
3.8(222 Google reviews)
Invictus Roofing and Solar
Leavenworth, KS
5.0(193 Google reviews)
Balmer Roofing & Solar LLC
Tonganoxie, KS
5.0(170 Google reviews)
Ratings snapshot: Google Maps, August 2026, via the DataForSEO SERP feed. Zero companies paid us and none are endorsed by us. Verify licensing, insurance, and permit requirements with the authority having jurisdiction.
Get your Kansas estimate
Answer four questions and receive a Kansas estimate using this page's EIA rate and PVGIS yield inputs. We are a solar installer and we also partner with other solar companies. Details in our disclosures.
What does your monthly electric bill look like?
Kansas average is $124 per month (EIA, 2024).